
Why a Monthly Finance Ritual Beats “Once-a-Year Panic”
Many owners only look hard at their numbers once a year—usually when tax season forces them to. By that time, it’s too late to course-correct.
Multiple sources argue that monthly financial reviews are one of the most effective habits you can build:
-
The U.S. Chamber of Commerce recommends monthly monitoring of key financial reports to measure health and outlook.
-
Accounting firms note that monthly financial statements allow you to spot trends and issues early, rather than looking backwards at the end of the quarter.
-
Advisory articles on financial reviews stress that regular check-ins help identify risks and growth opportunities before they become emergencies.
The good news: you don’t need to become a spreadsheet wizard. You just need five key numbers and 60–90 minutes each month.
Let’s walk through them.
Number 1: Ending Cash Balance (and Cash Runway)
If you only looked at one number, this would be it.
What it is:
Your ending cash balance is how much money is in all your business bank accounts at the end of the month, after deposits and payments clear.
Why it matters:
-
Cash is oxygen. You can be profitable on paper and still fail if you run out of cash.
-
Research repeatedly shows cash flow problems are the leading cause of failure—one study cited by SCORE and others attributes 82% of small business failures to cash flow issues.
How to use it:
-
Record ending cash each month (including savings, not just checking).
-
Divide by your average monthly operating expenses (e.g., rent, payroll, software, utilities, etc.).
-
The result is your cash runway in months.
Example: You have $90,000 in cash and spend about $30,000 per month. Your runway is 3 months.
Rules of thumb:
-
Aim for 2–3 months minimum runway as a baseline.
-
If you’re in a volatile industry or growing fast, 3–6 months is safer.
If your runway is shrinking month over month, you have an early warning sign—and time to adjust.
Number 2: Monthly Recurring Revenue (or Core Revenue)
Revenue can be noisy. To make it useful, define your core recurring revenue, even if you don’t run a subscription business.
What it is:
- For subscription/retainer businesses: your Monthly Recurring Revenue (MRR).
- For project/contract businesses: the typical monthly revenue from your core offerings, excluding one-off, abnormal spikes.
Why it matters:
- It tells you what you can reasonably count on next month.
- It helps you understand if growth is real or just the result of a big one-off contract.
How to use it:
- Track total revenue and core recurring revenue separately.
- Watch trend lines: is recurring revenue growing, flat, or declining?
Even a simple line chart over 12 months can tell you whether your business is becoming more stable or more fragile.
Number 3: Gross Margin
Too many owners obsess over top-line revenue but ignore gross margin—the percentage you keep after direct costs (like subcontractors, materials, or direct labor).
What it is:
Gross Margin = (Revenue – Cost of Goods Sold) ÷ Revenue
This number tells you how much is left to pay overhead and profit after delivering your service or product.
Why it matters:
- You can double revenue and still be worse off if your margin drops.
- It’s a key metric for pricing decisions and cost control.
How to use it:
- Calculate your gross margin each month.
- Compare it to previous months and to your target.
- When margins dip, look for causes: discounting, scope creep, overtime, rising supplier costs.
If you’re a service business, your “cost of goods sold” often includes billable staff wages, subcontractors, and any direct project costs.
Number 4: Operating Profit (or EBITDA) – and the Trend
Operating profit (or EBITDA for a more standardized view) tells you whether your core operations are actually making money once you’ve paid for overhead.
What it is:
- Operating profit = Gross profit – operating expenses (rent, admin salaries, marketing, software, etc.).
- EBITDA adds back interest, taxes, depreciation, and amortization for a cleaner comparison across time.
Why it matters:
- Many owners look at bank balance and revenue but ignore whether they’re truly profitable.
- Tracking profit month-to-month shows whether your growth is actually sustainable.
How to use it:
- Track operating profit in dollars and operating margin (profit ÷ revenue).
- Plot 3–6 months of operating profit in a simple chart.
You want to see:
- Fewer loss-making months over time
- A gradually improving margin as you refine pricing and process
If revenue is rising but profit is flat or shrinking, that’s your cue to review pricing, scope, or overhead.
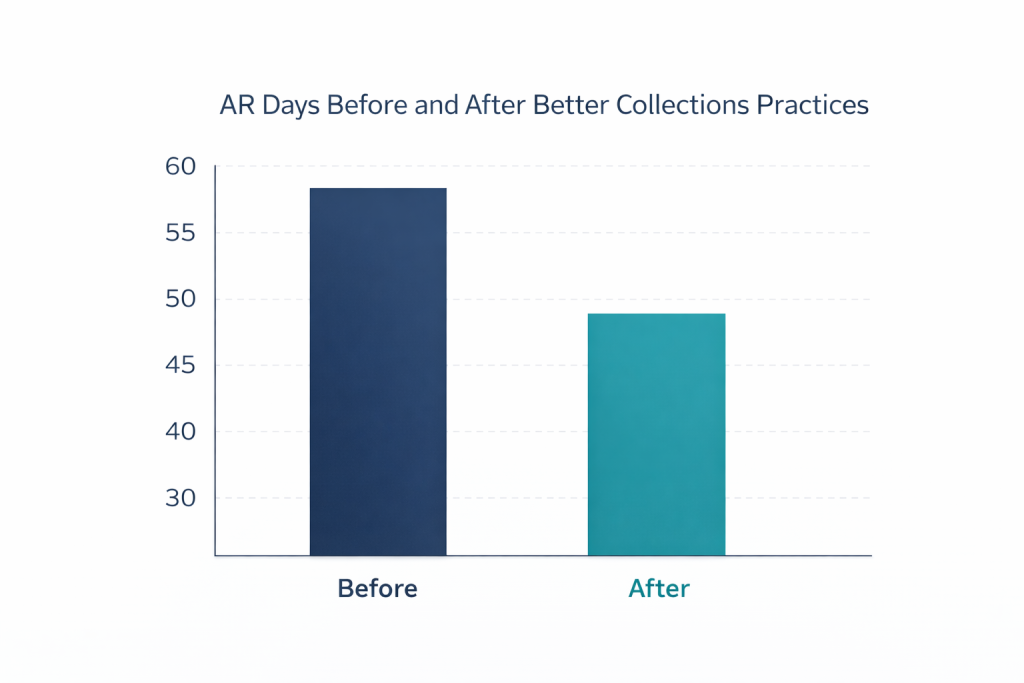
Number 5: Accounts Receivable Days (How Long It Takes to Get Paid)
You can have great sales and margins and still struggle if customers pay slowly.
What it is:
- Days Sales Outstanding (DSO) or AR Days measures how long it takes, on average, for you to collect payment.
DSO ≈ (Accounts Receivable ÷ Monthly Credit Sales) × 30
(You don’t have to be exact—an estimate is enough for small businesses.)
Why it matters:
- Slow collections choke cash flow.
- Tightening AR can be one of the fastest ways to improve cash without cutting anything.
How to use it:
- Calculate your AR days monthly.
- If it’s significantly higher than your payment terms (e.g., 45+ days on “Net 30” terms), you have a collections issue.
- Experiment with:
- Deposits or progress billing
- Faster invoicing
- Automatic reminders
- Card/ACH payment links on invoices
Even shaving 5–10 days off your AR can meaningfully boost cash.
Putting It All Together: A 60-Minute Monthly Review Ritual
Here’s a simple monthly ritual you can implement today:
- Block 60–90 minutes on your calendar for a “Finance Review” (ideally the same day each month).
- Print or open (a) your P&L, (b) balance sheet, and (c) cash flow statement for the month.
- Fill out a one-page worksheet with:
- Ending cash & runway
- Core recurring revenue
- Gross margin %
- Operating profit & margin
- AR days
- Add three quick notes:
- What looks better than last month?
- What looks worse?
- What 1–2 actions will I take this month as a result?
Keep this simple. Consistency beats complexity.
The Take-Home Message
You don’t need 50 KPIs. You need a small, sharp dashboard that you actually look at.
By reviewing just these five numbers each month:
- Ending cash & runway
- Core revenue / MRR
- Gross margin
- Operating profit
- AR days
…you’ll see trouble months earlier, not after it’s too late to respond.